Link Building KPIs: What to Track and Report to Clients
Published on October 14, 2026 | 6 Min Read
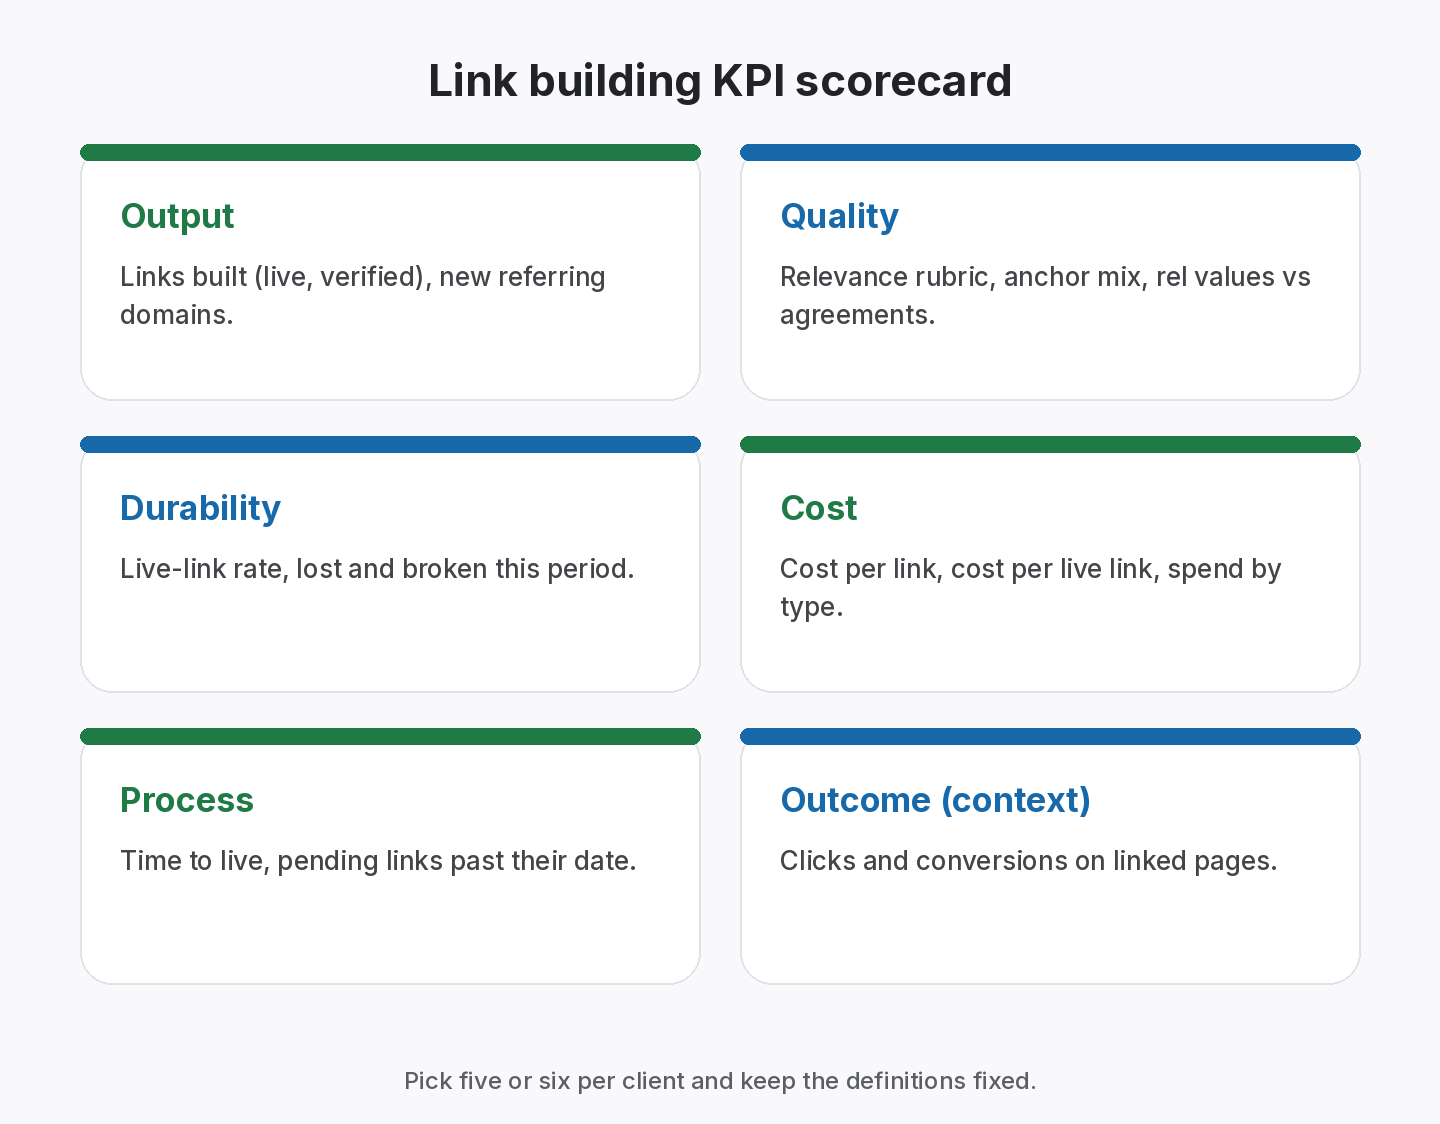
Key takeaways
- Good link building KPIs measure the work, its quality, its durability and its cost, not just a count of links.
- Core KPIs: links built, live-link rate, new referring domains, relevance, cost per live link and time to live.
- Outcome metrics such as target page traffic and rankings are context, not proof that specific links worked.
- Report lost links and fixes alongside wins; it builds trust.
- Choose five or six KPIs per client and keep their definitions identical every month.
Link building KPIs are the measures you use to judge whether link building work is on track: how many links were built, how many are still live, how relevant they are, what they cost and what effect they are having. The trap is to report one number, total links, which says nothing about quality or durability. A balanced set of link building KPIs covers output, quality, durability, cost and outcome, with clear definitions that don’t change from month to month. This guide lists the KPIs worth tracking, how to calculate each, and how to present them to clients without over-claiming.
Link building KPIs at a glance
| KPI | What it tells you | How to calculate | Category |
|---|---|---|---|
| Links built | Output this period | Count of links that went live | Output |
| Live-link rate | Durability | Live links ÷ all links built to date | Durability |
| New referring domains | Breadth | Unique new linking domains | Output |
| Relevance score | Quality | Share of links from on-topic pages (your rubric) | Quality |
| Cost per live link | Efficiency | Total cost ÷ links still live | Cost |
| Time to live | Speed | Days from agreement to live link | Process |
| Pending ageing | Pipeline health | Links pending longer than an agreed time | Process |
| Target page performance | Outcome context | Clicks and conversions on linked pages | Outcome |
A balanced KPI set works best for retainers, but falls short when “links built” is the only number clients see.
Why “number of links” isn’t enough
Counting links rewards volume. It doesn’t show whether links are relevant, whether they lasted, or what they cost. A month with 20 low-quality links that vanish by the next quarter looks better on a count than a month with 5 strong placements that last for years. Clients eventually notice. A KPI set that includes durability, quality and cost avoids that trap and makes reports more credible.
Output KPIs
Links built
The number of links that went live in the period. Define “built” clearly: live and confirmed, not just agreed. Split by type (exchange, guest post, paid, listing) so the client sees the mix.
New referring domains
Unique domains that linked for the first time. Ten links from one site are not the same as ten links from ten sites; this KPI shows breadth.
Quality KPIs
Relevance
Use a simple rubric: is the linking page on a topic related to the target page, and would its readers plausibly care? Score each link yes, partly or no, and report the share. A rubric beats a third-party authority score, because it reflects why the link should exist.
Link type and rel value
Report how many links are normal, nofollow or sponsored. This isn’t a quality grade, since paid links should be sponsored, but it shows whether links match agreements. See nofollow vs dofollow for definitions.
Anchor mix
The share of branded, URL, generic, partial and exact anchors on built links. A rising exact-match share is a warning sign; our anchor text ratio guide explains why.
Durability KPIs
Live-link rate
Live links ÷ all links built to date. This is the KPI most reports leave out, and the one clients value once they see it. It shows whether the links you build stay built.
Lost and broken this period
The number of links that went Lost (page live, link gone) or Broken (page gone), with what you did about each. Showing losses openly is the fastest way to build trust.
Report KPIs from one live link list
Track status, type and cost per link, then share a report link with clients.
Cost KPIs
Cost per link and cost per live link
Total spend ÷ links built, and total spend ÷ links still live. The second is more honest because it accounts for losses. Include time and content costs where you can. Our guide to measuring link building ROI covers what counts as cost.
Spend by type
How the budget splits between paid placements, content for guest posts, outreach time and tools. It helps clients see where money goes.
Process KPIs
Time to live
Days from agreement to live link. Long times often point to slow editors or vague briefs.
Pending ageing
Links agreed but not live after an agreed number of days. These need a follow-up or should be closed.
Outcome metrics (as context)
Clients ultimately care about traffic, leads and revenue. Report on the linked pages:
- organic clicks and impressions from Google Search Console;
- rankings for the pages’ main queries;
- conversions from organic visits.
Be careful with attribution. Many things move these numbers. Say “the pages we built links to gained X clicks this quarter” rather than “our links drove X clicks”, and note content updates or seasonality in the same period.
How to set targets
- Agree definitions first. What counts as built, relevant, lost.
- Base targets on capacity, not on what sounds impressive.
- Use ranges for outcome metrics, which you don’t fully control.
- Set a durability target, such as a minimum live-link rate, alongside output.
- Review quarterly, not monthly, for anything outcome-related.
Presenting KPIs to clients
- Lead with a short summary: what was built, what was lost and fixed, what’s next.
- Show five or six KPIs, the same ones every month.
- Use the same definitions and date ranges each time.
- Put outcome metrics in context, with caveats.
- Link to the full link list for anyone who wants detail.
Our link building report template shows how these fit into a monthly report.
Worked example: one client’s monthly scorecard
Here is how a monthly KPI summary might read for a retainer client. The figures are illustrative, not from a real account.
| KPI | This month | Last month | Note |
|---|---|---|---|
| Links built (live, verified) | 6 | 5 | 3 guest posts, 2 exchanges, 1 sponsored |
| New referring domains | 6 | 4 | All on-topic |
| Live-link rate (all time) | 92% | 93% | One lost link this month |
| Lost / broken | 1 lost | 0 | Guest post edited; restore requested |
| Cost per live link | $210 | $230 | Lower content cost |
| Median time to live | 19 days | 24 days | Faster editor responses |
Underneath, a short paragraph covers target page performance: “The three pages we built links to gained organic clicks this month, alongside a content refresh on one of them.” That sentence is honest about attribution and still gives the client the context they want.
KPIs to avoid or use carefully
- Total links ever built: grows forever and hides losses.
- Third-party authority averages: useful as rough context, but not Google metrics and easy to game.
- Rankings for a single keyword: too noisy to judge link work month to month.
- “Estimated traffic value” from tools: fine as context, but label it an estimate.
- Outreach emails sent: an activity measure, not a result; keep it internal.
How to choose your KPIs
- Small retainers: links built, live-link rate, cost per live link.
- Larger programmes: add relevance, anchor mix and time to live.
- Paid-heavy campaigns: add spend by type and rel value compliance.
- Clients focused on outcomes: add target page clicks and conversions, with context.
- Internal team reviews: add pending ageing and time to live by team member.
From the SEOENV team
The KPI that changed client conversations most for us was live-link rate. Once clients could see that links stayed live, and that lost ones were followed up, the discussion moved from “how many?” to “which pages next?”.
How SEOENV helps with link building KPIs
SEOENV keeps the raw data behind most of these KPIs: each link’s status (Active, Pending, Lost or Broken), type (Dofollow, Nofollow or Unknown), anchor, cost and client. The Dashboard shows an account overview, and you can share reports with clients without a login using client share links. Starter ($29 a month) adds the Link Status Report and daily automatic checks; Growth ($149 a month) adds the Anchor Text Heatmap and white-label reports. See link building reports.
SEOENV doesn’t import analytics or ranking data. Outcome metrics come from your own analytics and Search Console.
Sources
- Google Search Console Help: Performance report
- Google Search Console Help: Links report
- Google Search Central: Creating helpful, reliable, people-first content
How we wrote this guide
This guide is written by the SEOENV team from how link builders actually record exchanges, paid placements and guest posts. SEOENV makes a backlink manager, so we say where a spreadsheet or another tool is enough. We do not quote statistics we cannot source.
Frequently asked questions
Related reading
Keep every link you build on record
Log exchanges, ABC swaps, paid links and guest posts in one place. The Free plan covers every link type for up to 20 links.


[…] Previous […]
[…] Whatever you cut, keep the link list and status changes. Those two sections are the evidence behind every other number. For the metrics to put in the summary, see link building KPIs. […]
[…] records you use to manage links: links built, live-link rate, lost and fixed, anchors, spend. Our link building KPIs guide suggests which measures to show. Invoice from the same data, so a placement on the report is the […]